
Only 10 of the 32 Fracking Companies secured positive cash flows for the quarter and eight generated positive cash flows over the trailing 12-month period. The inability of fracking-focused companies to generate consistent free cash flows, even with soaring production and higher oil prices, raises a critical question: will these companies ever produce enough cash from oil and gas sales to cover their capital outlays? Only when they do that will the industry have any hope of paying back its sizable debts—or of producing robust rewards for equity investors. Moving forward, the drop in oil prices in recent weeks poses additional financial challenges to the industry. From Oct. 1 through the end of November, the U.S. benchmark price for a barrel of oil dropped to $51from $75, a precipitous 32 percent plunge. Considering how fracking companies generated negative free cash flows while Q3 oil prices averaged $70/barrel, cash flows likely will turn even more negative in Q4.
oil and gas companies continued their nine-year losing streak through Q3,
2018.
The 32 mid-size U.S. exploration companies included in this review reported nearly
$1 billion in negative cash flows through September.
Falling oil prices and rising interest rates will pose additional financial challenges to
the industry in Q4.
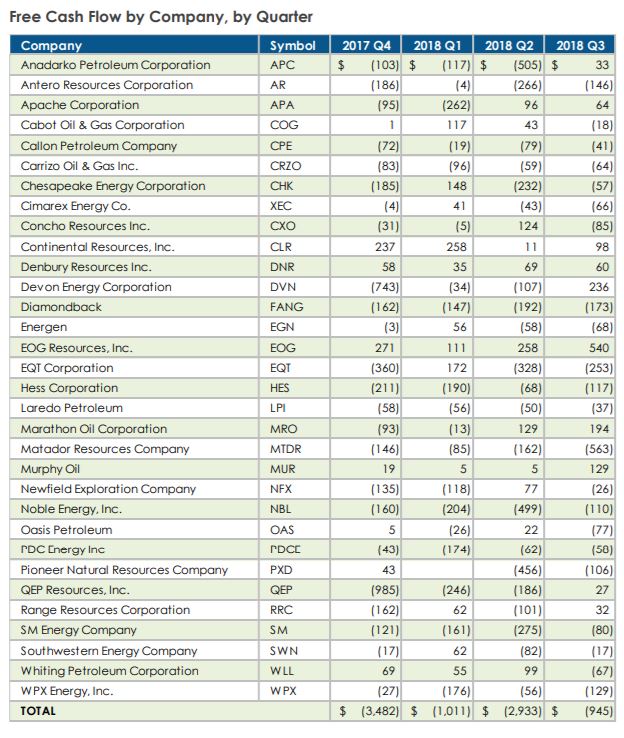
Free Cash Flow by Company, by Quarter
Company Symbol – 2017 Q4 2018 Q1 2018 Q2 2018 Q3
Anadarko Petroleum Corporation APC $ (103) $ (117) $ (505) $ 3 3
Antero Resources Corporation AR (186) (4) (266) (146)
Apache Corporation APA (95) (262) 9 6 6 4
Cabot Oil & Gas Corporation COG 1 117 4 3 (18)
Callon Petroleum Company CPE (72) (19) (79) (41)
Carrizo Oil & Gas Inc. CRZO (83) (96) (59) (64)
Chesapeake Energy Corporation CHK (185) 148 (232) (57)
Cimarex Energy Co. XEC (4) 4 1 (43) (66)
Concho Resources Inc. CXO (31) (5) 124 (85)
Continental Resources, Inc. CLR 237 258 1 1 9 8
Denbury Resources Inc. DNR 5 8 3 5 6 9 6 0
Devon Energy Corporation DVN (743) (34) (107) 236
Diamondback FANG (162) (147) (192) (173)
Energen EGN (3) 5 6 (58) (68)
EOG Resources, Inc. EOG 271 111 258 540
EQT Corporation EQT (360) 172 (328) (253)
Hess Corporation HES (211) (190) (68) (117)
Laredo Petroleum LPI (58) (56) (50) (37)
Marathon Oil Corporation MRO (93) (13) 129 194
Matador Resources Company MTDR (146) (85) (162) (563)
Murphy Oil MUR 1 9 5 5 129
Newfield Exploration Company NFX (135) (118) 7 7 (26)
Noble Energy, Inc. NBL (160) (204) (499) (110)
Oasis Petroleum OAS 5 (26) 2 2 (77)
PDC Energy Inc PDCE (43) (174) (62) (58)
Pioneer Natural Resources Company PXD 4 3 (456) (106)
QEP Resources, Inc. QEP (985) (246) (186) 2 7
Range Resources Corporation RRC (162) 6 2 (101) 3 2
SM Energy Company S M (121) (161) (275) (80)
Southwestern Energy Company SWN (17) 6 2 (82) (17)
Whiting Petroleum Corporation WLL 6 9 5 5 9 9 (67)
WPX Energy, Inc. WPX (27) (176) (56) (129)
TOTAL $ (3,482) $ (1,011) $ (2,933) $ (945)
5 thoughts on “Only 10 of the 32 Fracking Companies secured positive cash flows for the quarter”